
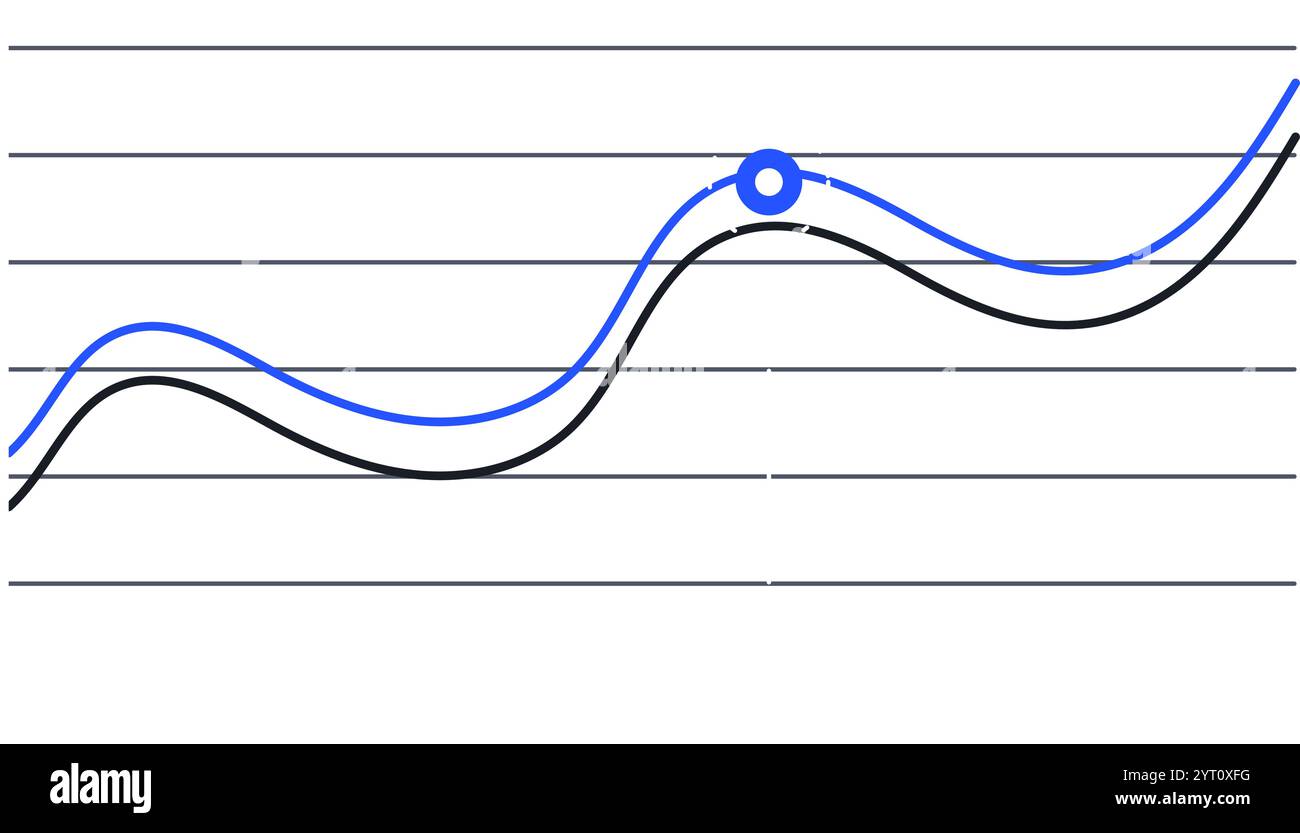
Two lines are representing data progression over time, one blue and one black, creating a visual representation of trends and a key intersection point
RFID:Image ID:2YT0XFG
Image details
Contributor:
Veronika OliinykImage ID:
2YT0XFGReleases:
Model - no | Property - noDo I need a release?More information:
Two lines are representing data progression over time, one blue and one black, creating a visual representation of trends and a key intersection point is marked with a blue circle

