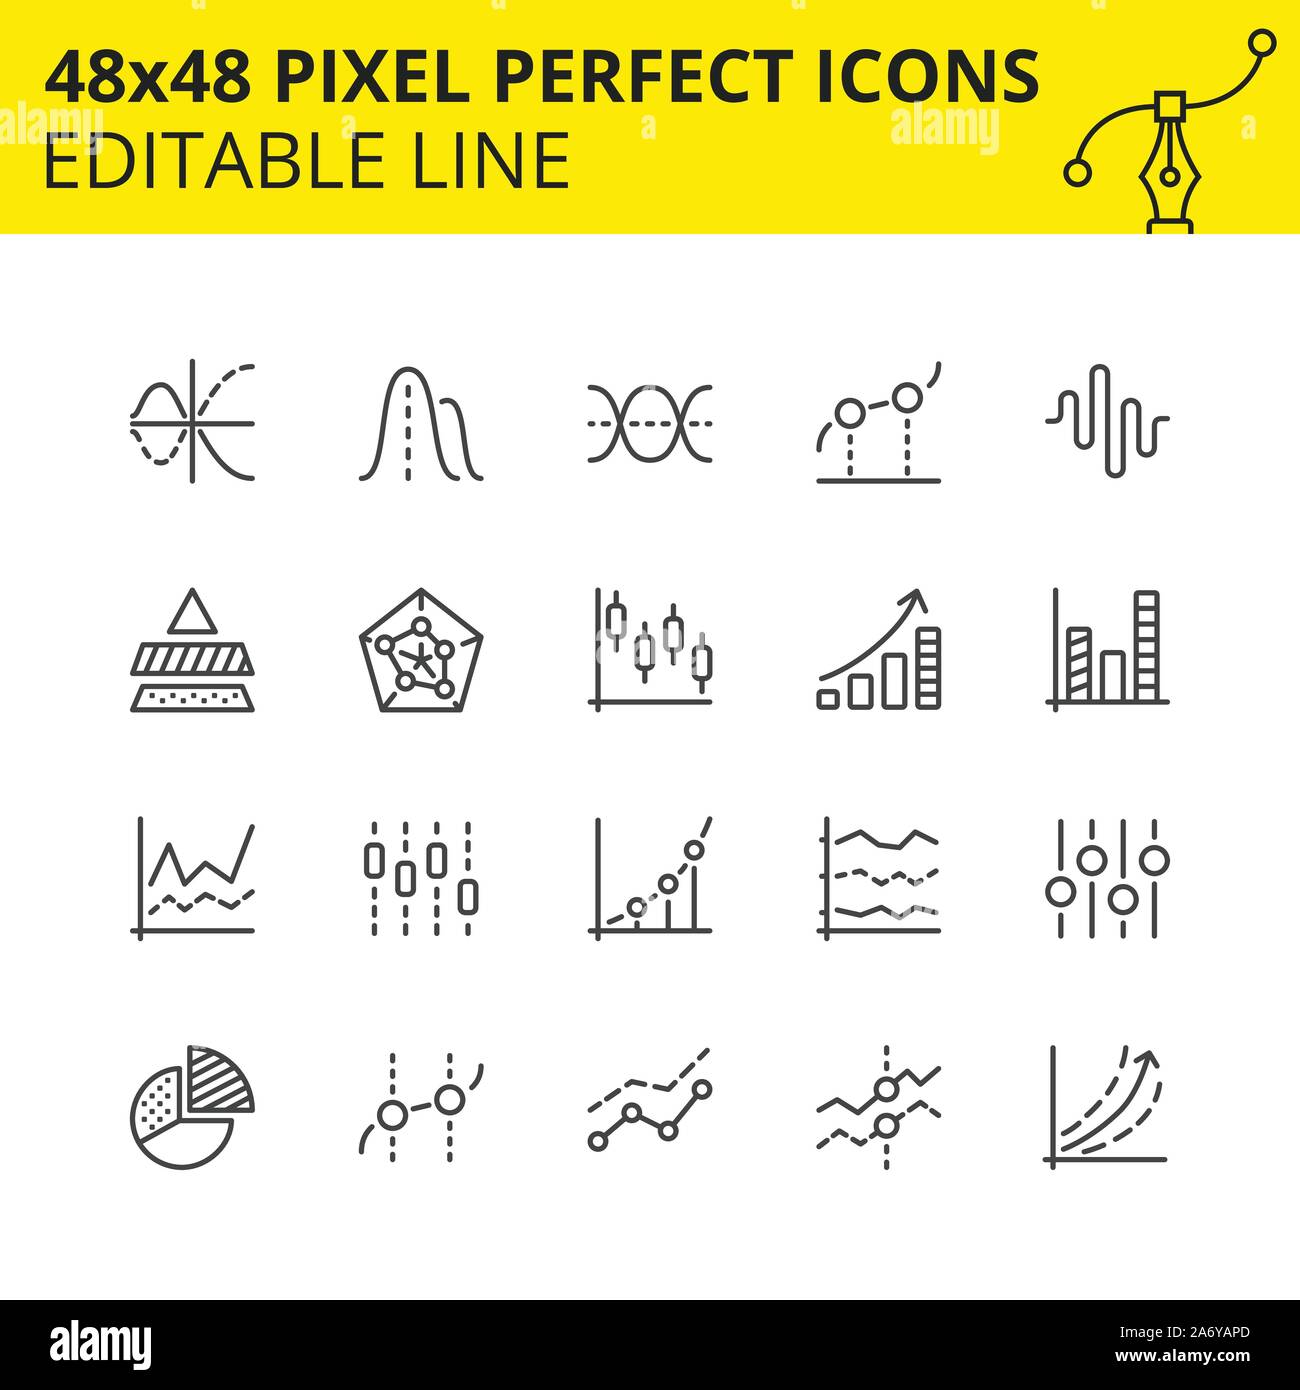
···Line graphs, pie charts, bar and scatter plot. Can be used for representing data in many areas as statistics, data science, math, economics, business.RFID:Image ID:2A6YAPDPreviewSaveShareImage detailsContributor:Pixel_hunterImage ID:2A6YAPDReleases:Model - no | Property - noDo I need a release?Date created:29 October 2019Location:BelarusView related stock videos